In progress · Private beta

Angreal

Ask a question, get the number and the filing it came from. Angreal is a research workspace I'm building that turns SEC filings and Federal Reserve data into answers, from the economy down to a single company's 10-K.

Type a question like "META pe ratio trend over time" and it pulls the figures straight from SEC filings, adds market prices, and shows where each number came from.

71built-in research commands
7public data sources in one search bar
~150SEC form types readable in the app
Angreal's economic dashboard with the Fed funds rate, Treasury yields, CPI, unemployment and GDP
Role: sole designer & developer Timeline: Feb 2026 – present Platforms: macOS desktop · web · iOS prototype Data: SEC EDGAR, FRED, BLS, BEA, World Bank
The project

One place to research a stock, from the economy down to the 10-K

Researching a company means jumping between a lot of sites: EDGAR for filings, a data provider for financials, a chart site for prices, FRED for the economy. Angreal puts all of it in one desktop app with a single search bar.

You type a question like "META pe ratio trend over time" or "MSFT retained earnings over time". Angreal pulls the figures straight from companies' SEC filings, combines them with market prices, and answers in seconds. Each answer cites where its numbers came from.

I designed and built every part of it: the interface, the query engine that turns a sentence into the right SEC data request, the local API server, and the macOS packaging.

71built-in commands across 13 categories
7public data sources behind one search bar
~150SEC form types readable inside the app
9.4klines of code in the desktop app
Walkthrough

Researching a company with Angreal

Here is how a research session flows, from the big picture down to the source document. Every screenshot comes from the desktop app with live data. Click any image to enlarge it.

1

Start with a question

Angreal opens on a single search bar. You can type a plain-English question or click one of the starter prompts. Past research stays in the sidebar, grouped into chats and projects.

Use TICKER: to look up a company or FUND: to look up an investment manager.
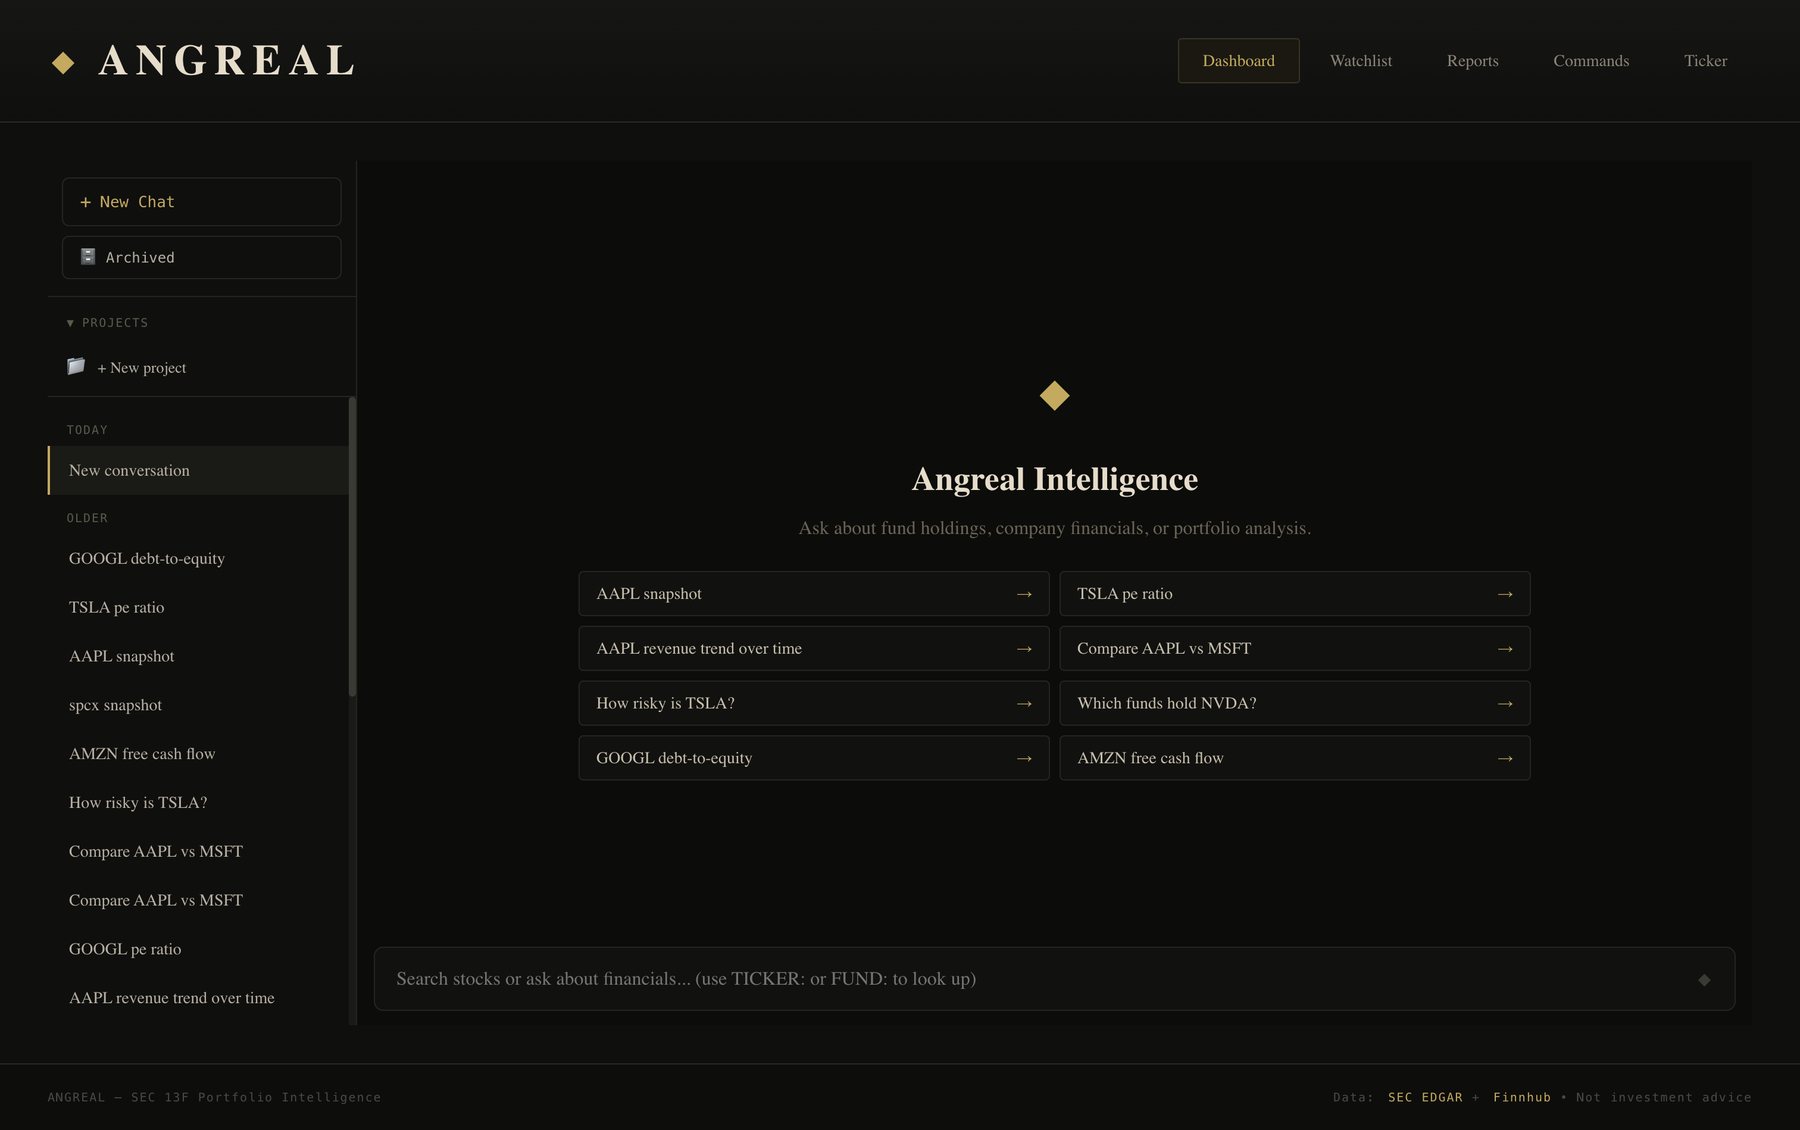
Angreal Intelligence home screen with a search bar and eight suggested questions
Dashboard. The home screen, with suggested questions and your research history on the left.
2

Read the economy first

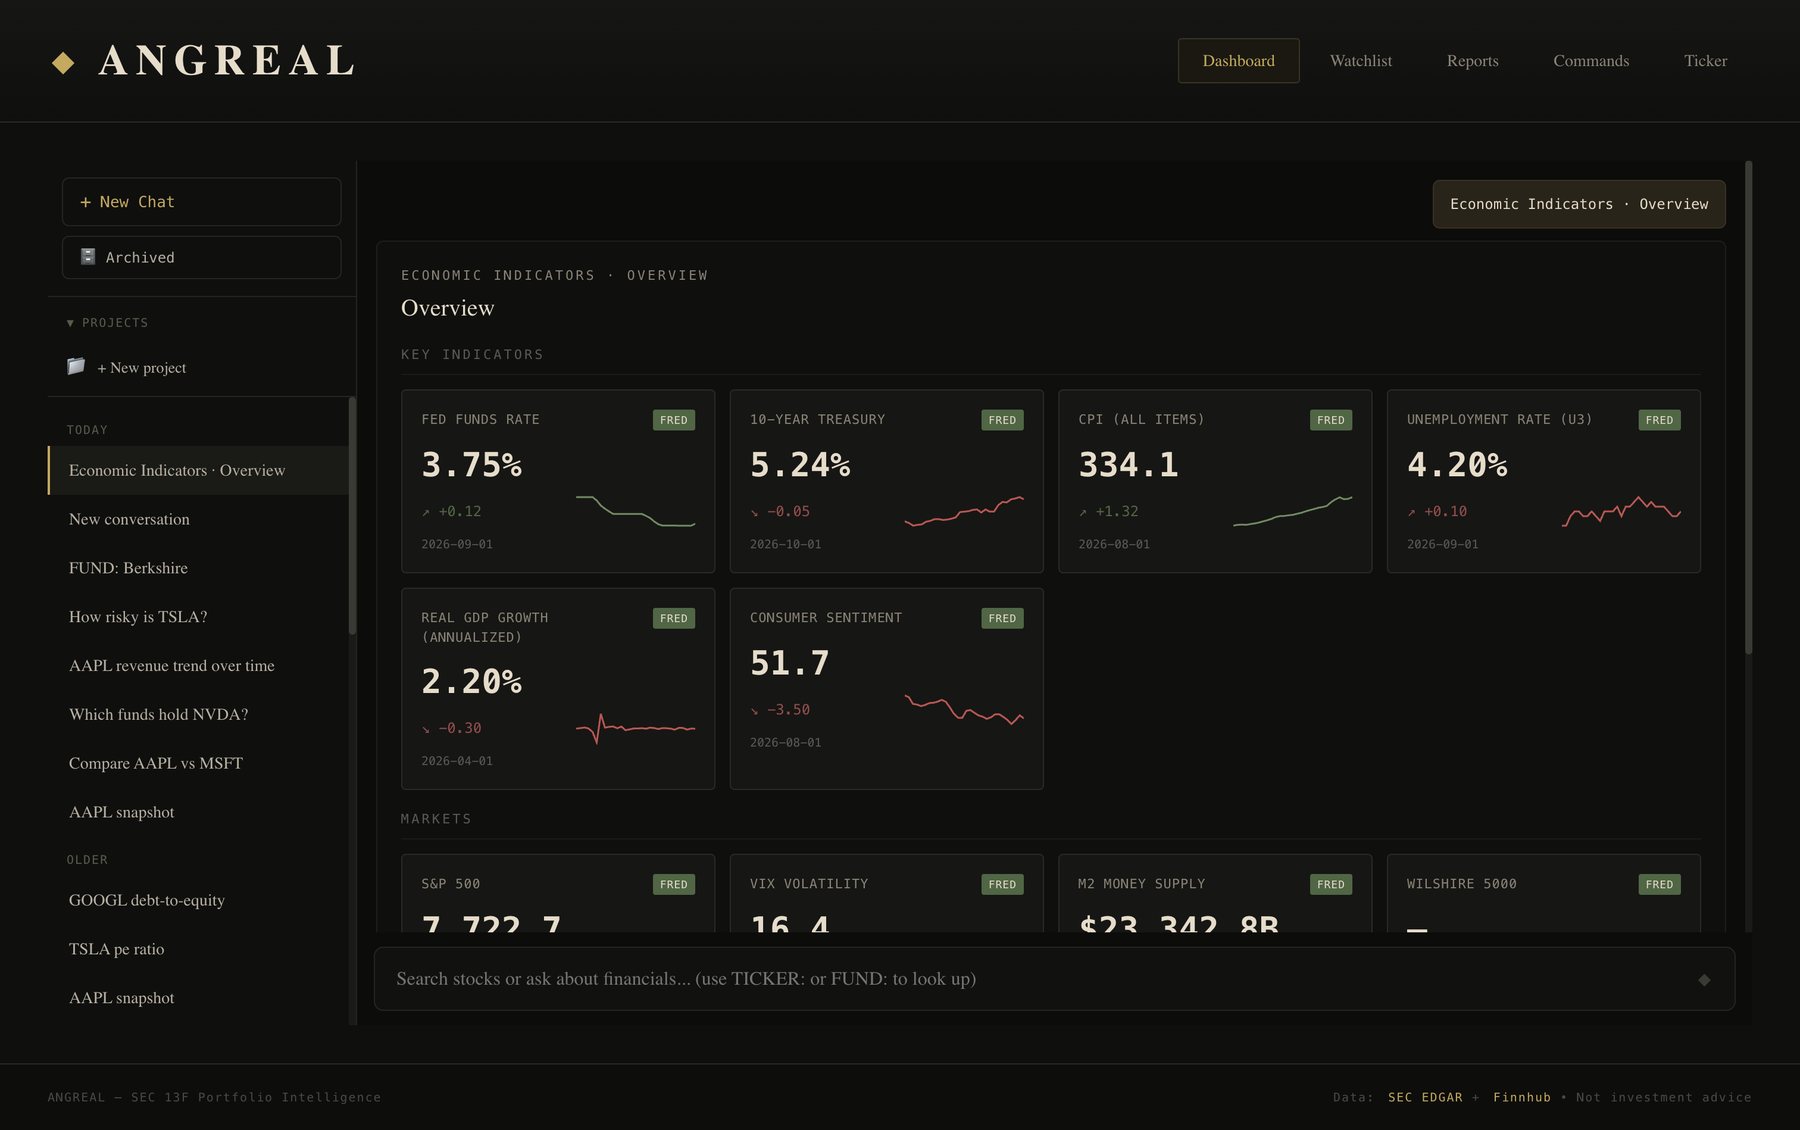
Before looking at a company, check the backdrop. The Economic Indicators dashboard pulls live data from FRED, BLS, BEA and the World Bank. It covers rates, inflation, jobs, GDP, markets, housing and global growth.

Open Commands → Economic Indicators and pick a group.

Economic overview with six indicator cards and sparklines
Overview. Headline indicators with their latest reading, the change, and a trend line.
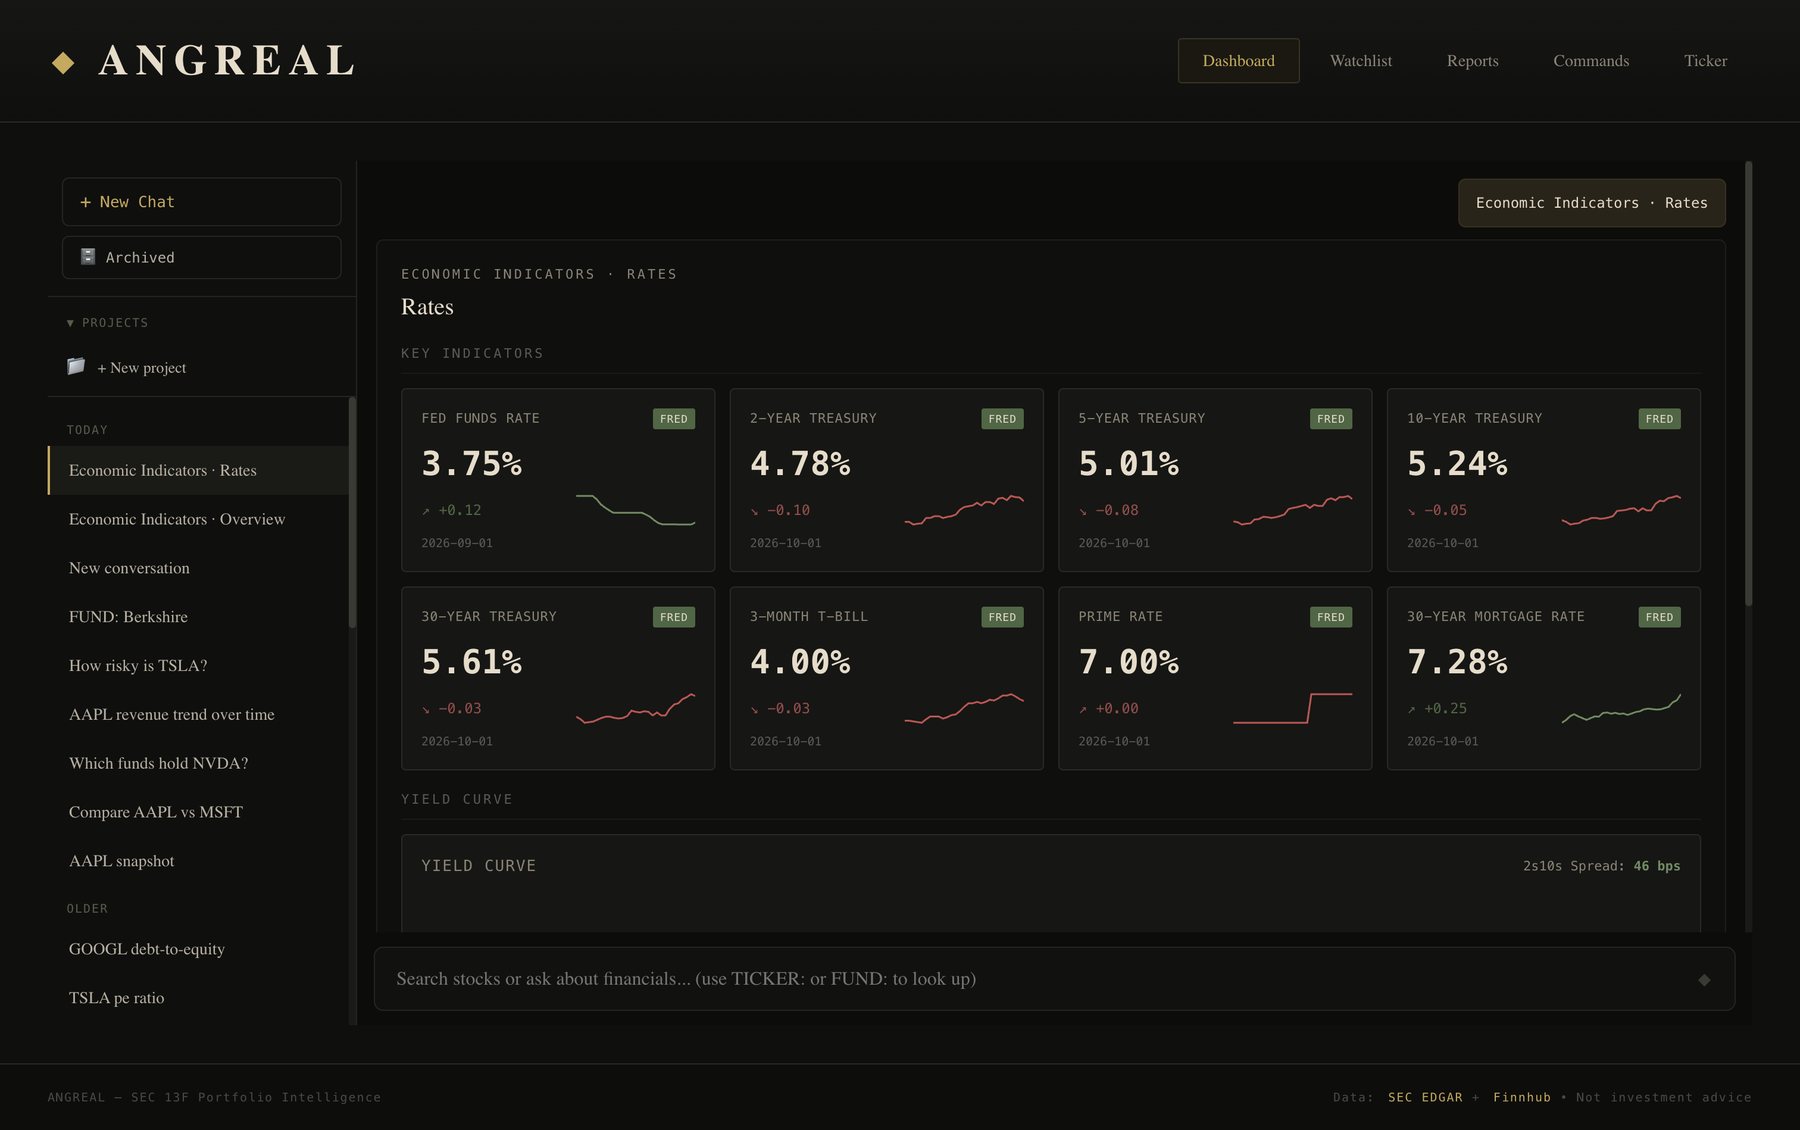
Rates dashboard with Treasury yields, prime rate and mortgage rate
Rates. Fed funds, Treasuries from 3 months to 30 years, prime and mortgage rates.
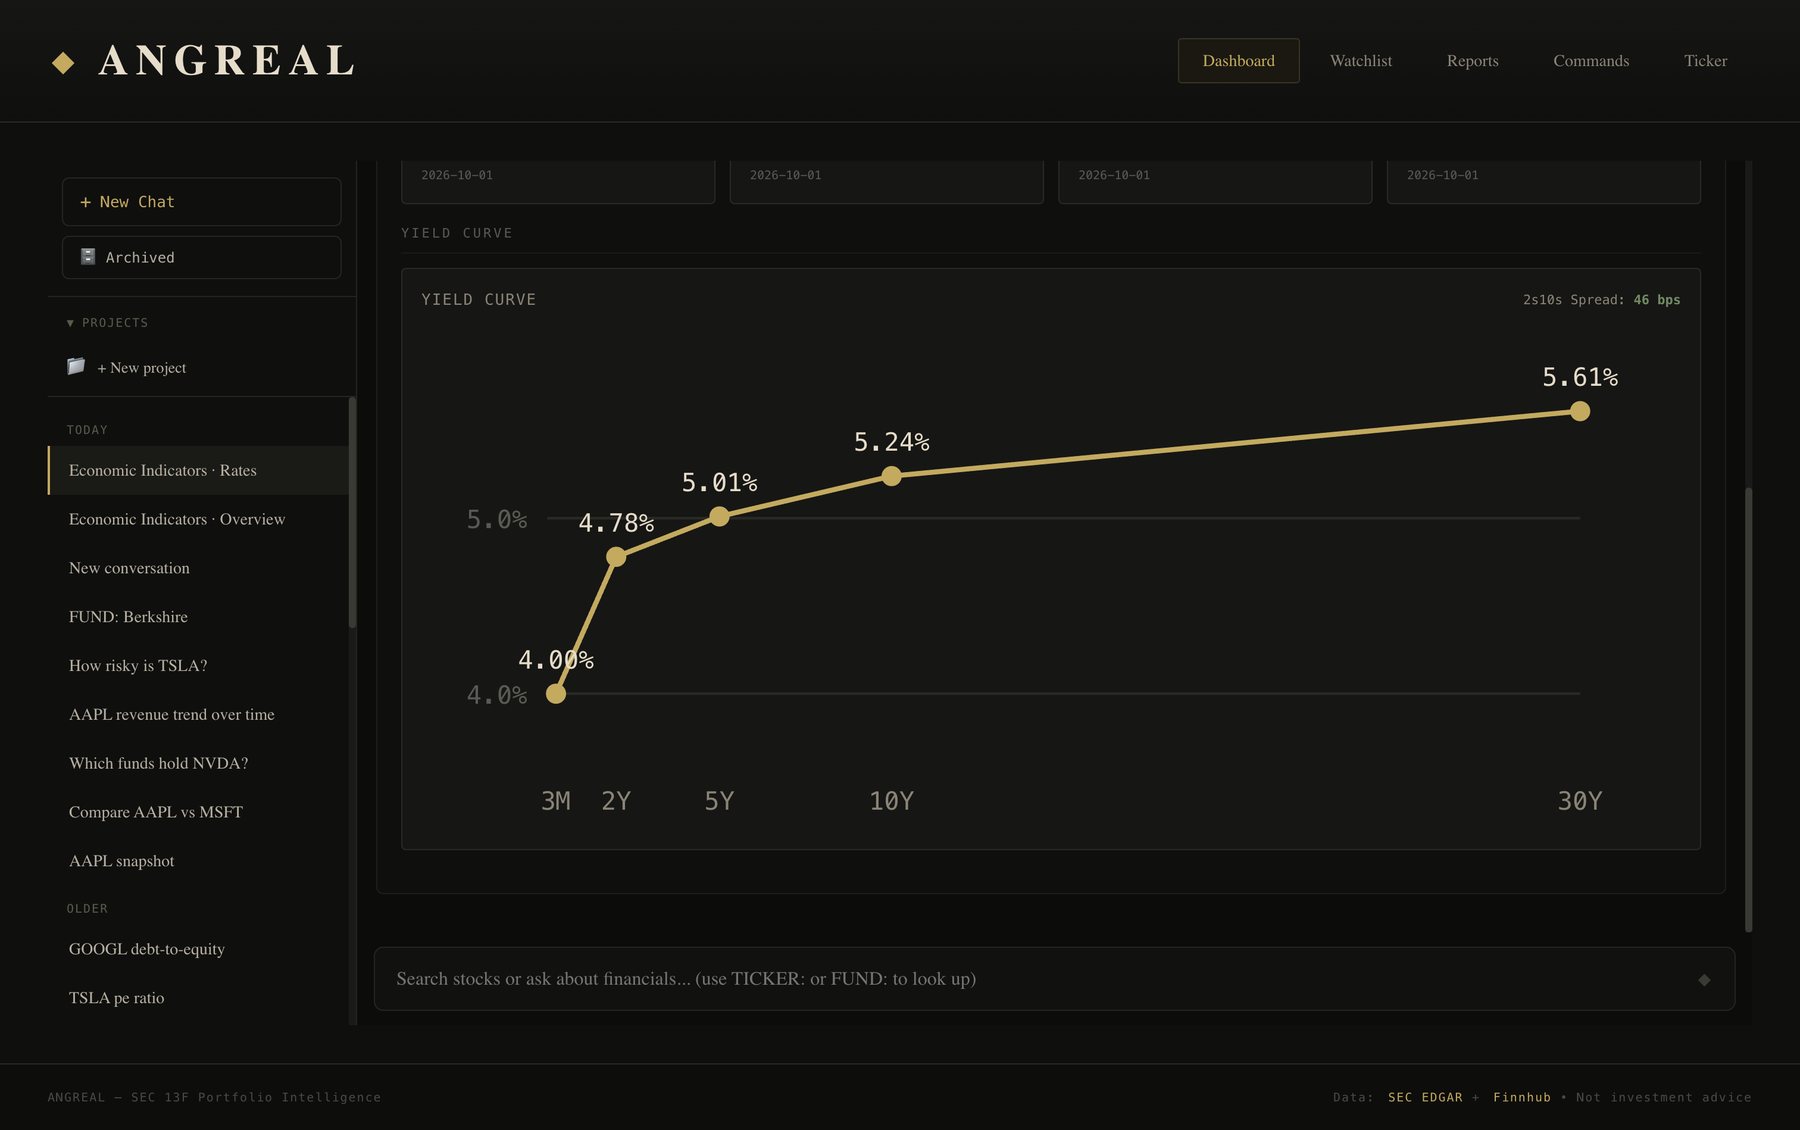
Treasury yield curve chart from 3 months to 30 years
Yield curve. Today's curve, plotted with the 2s10s spread.
3

Find the company

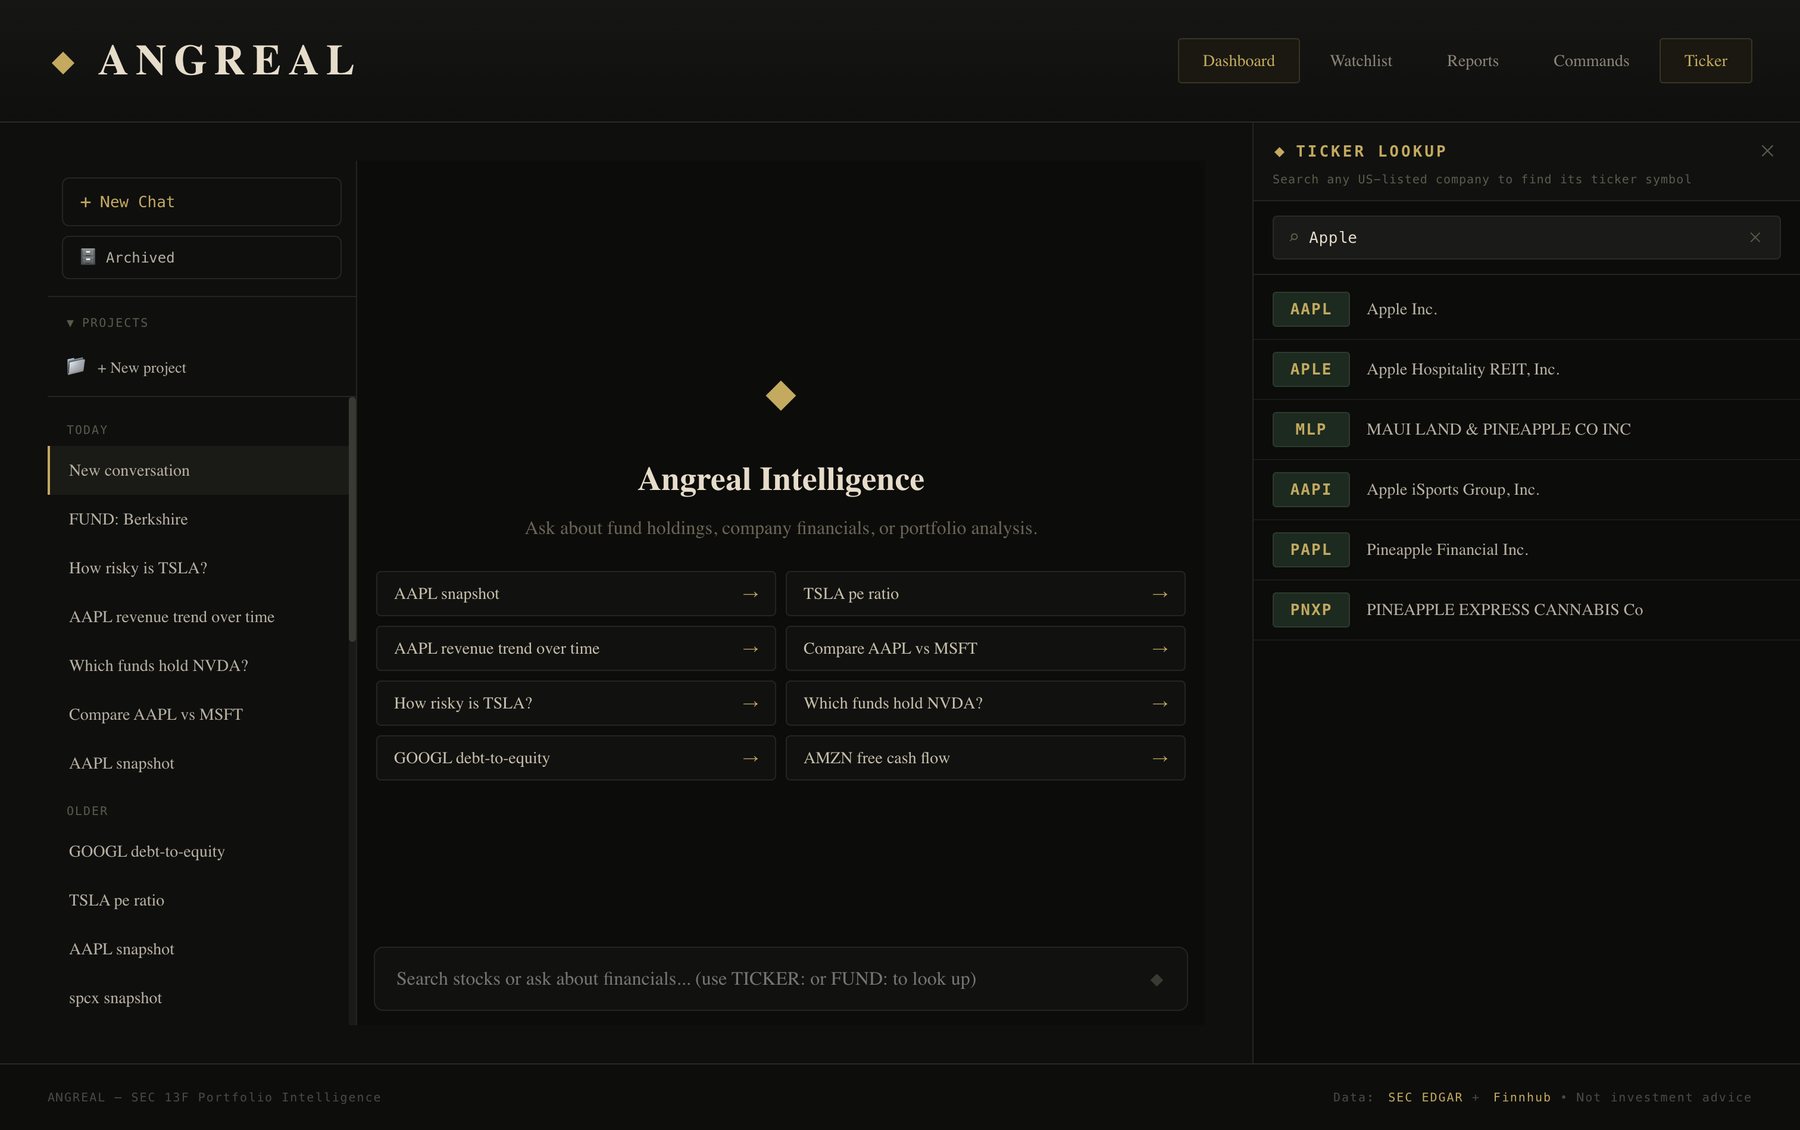
If you don't know the ticker, search by name. Ticker Lookup covers every US-listed company in the SEC's ticker file and updates as you type.

Click Ticker in the top bar.

Ticker lookup panel showing results for Apple: AAPL, APLE, MLP, AAPI, PAPL, PNXP
Ticker Lookup. Typing "Apple" finds AAPL first, plus every other company with "apple" in its name.
4

Understand the business

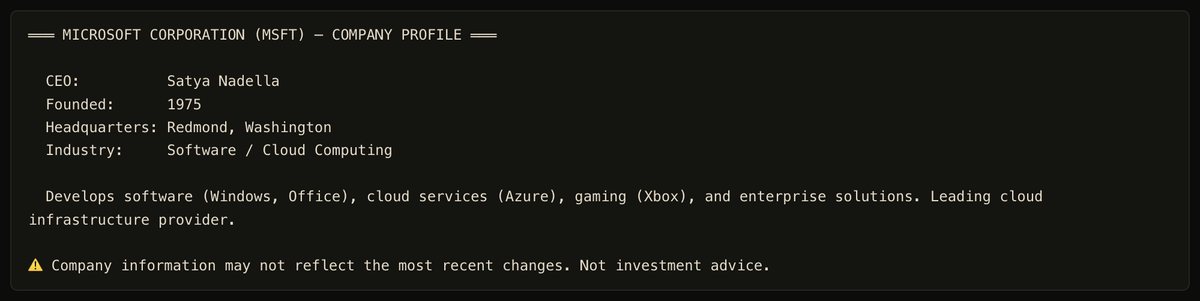
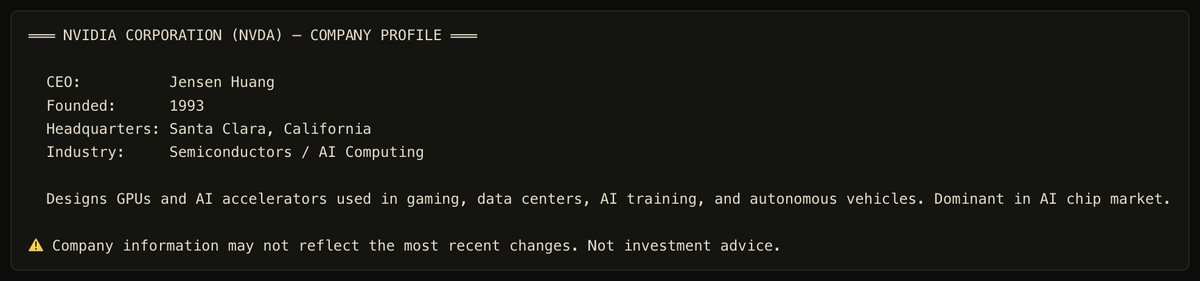
Ask who runs the company, where it's based or what industry it's in, and you get a short profile card with the CEO, founding year, headquarters and a one-line description.

Who is the CEO of MSFT?Microsoft company profile: CEO Satya Nadella, founded 1975, Redmond, Washington
Where is NVDA headquartered?NVIDIA company profile: CEO Jensen Huang, founded 1993, Santa Clara, California
5

Pull any line item

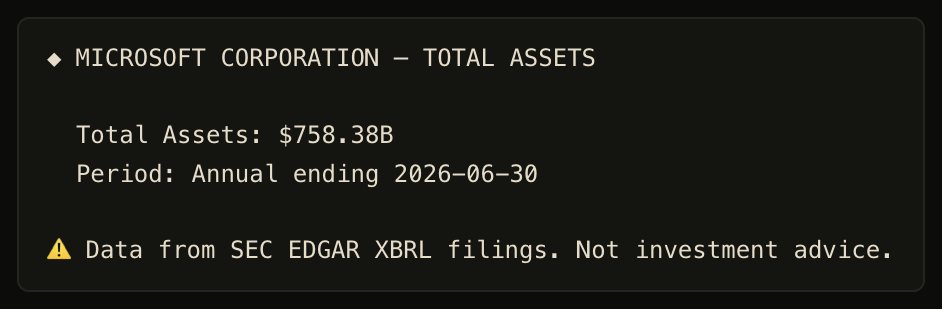
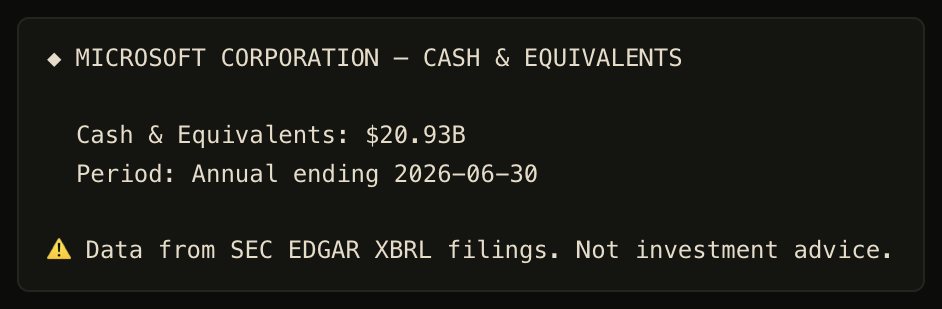
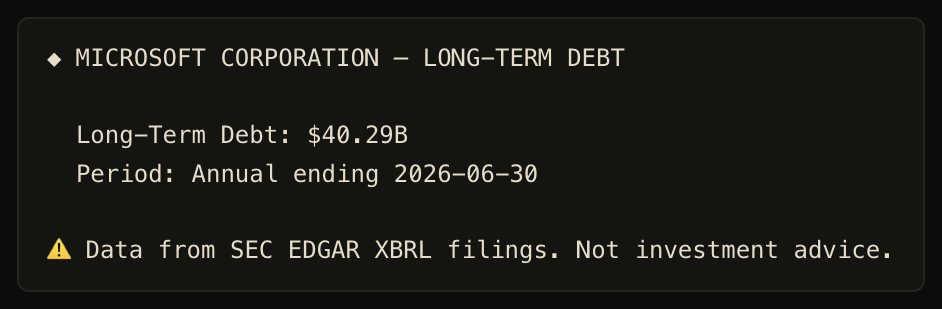
Every figure on the income statement, balance sheet and cash flow statement is one question away. Angreal reads the company's XBRL data from EDGAR, picks the latest annual or trailing-twelve-month value, and shows the period it covers.

Dozens of line items and ratios, from total assets to effective tax rate.

MSFT total assetsMicrosoft total assets: $758.38B, annual ending 2026-06-30
MSFT cashMicrosoft cash and equivalents: $20.93B
MSFT long term debtMicrosoft long-term debt: $40.29B
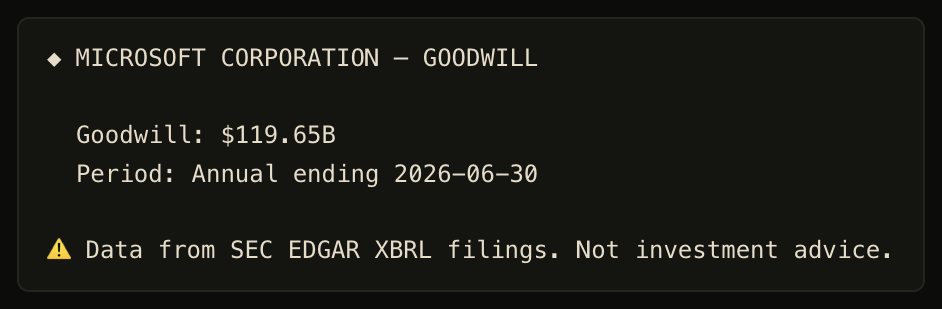
MSFT goodwillMicrosoft goodwill: $119.65B
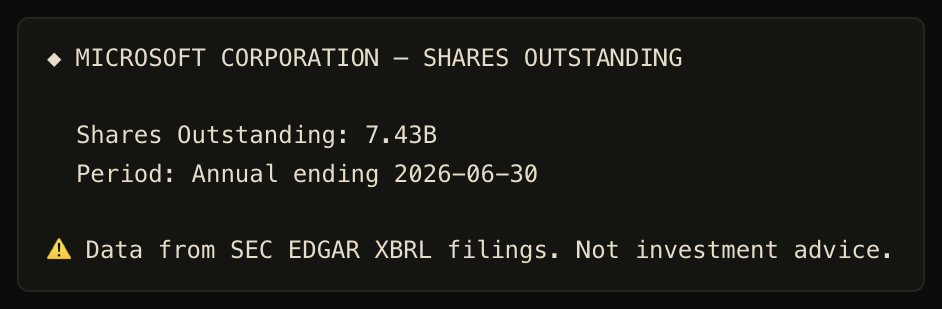
MSFT shares outstandingMicrosoft shares outstanding: 7.43B
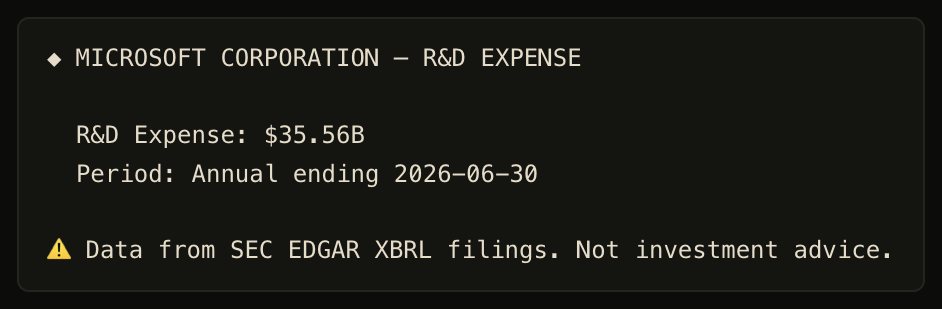
MSFT r&dMicrosoft R&D expense: $35.56B
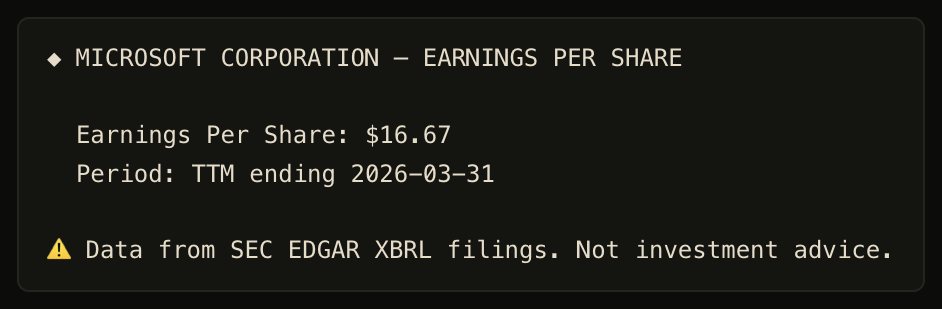
MSFT earnings per shareMicrosoft earnings per share, trailing twelve months: $16.67
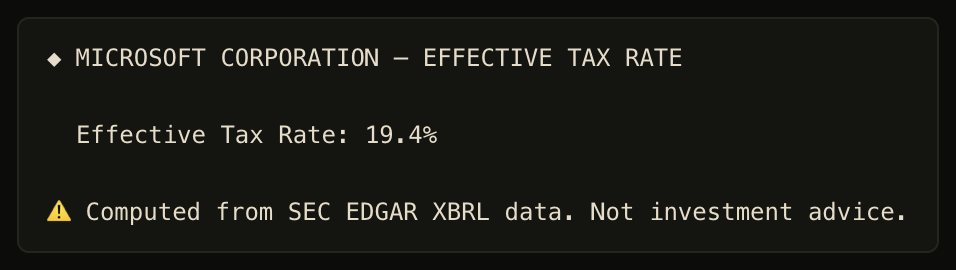
MSFT effective tax rateMicrosoft effective tax rate: 19.4%
6

See the long-term trend

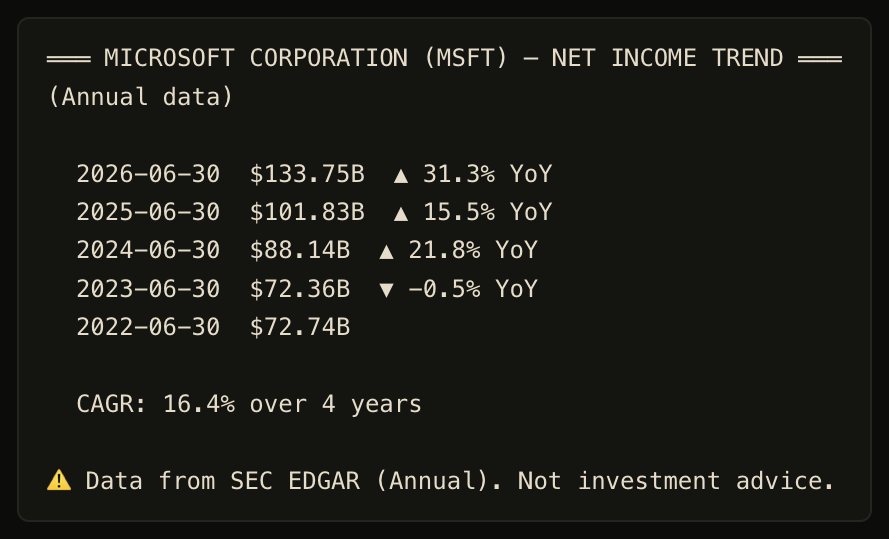
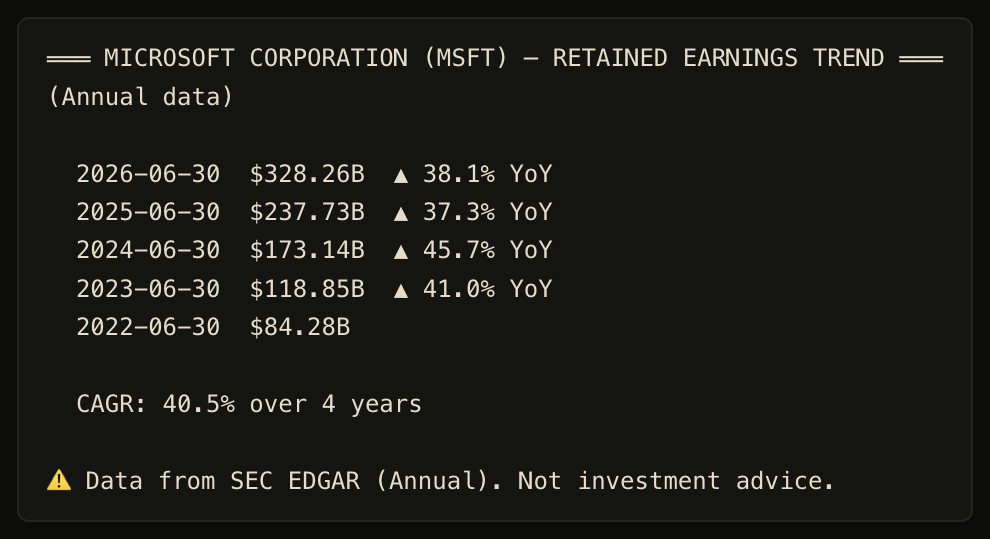
A single year can mislead, so Angreal shows the history too. Trend commands list each fiscal year with its year-over-year change and the compound annual growth rate (CAGR) across the whole period.

Try MSFT net income trend or MSFT retained earnings over time.

MSFT net income trendMicrosoft net income trend from $72.74B in 2022 to $133.75B in 2026, 16.4% CAGR
MSFT retained earnings over timeMicrosoft retained earnings from $84.28B in 2022 to $328.26B in 2026, 40.5% CAGR
7

Put a price on it

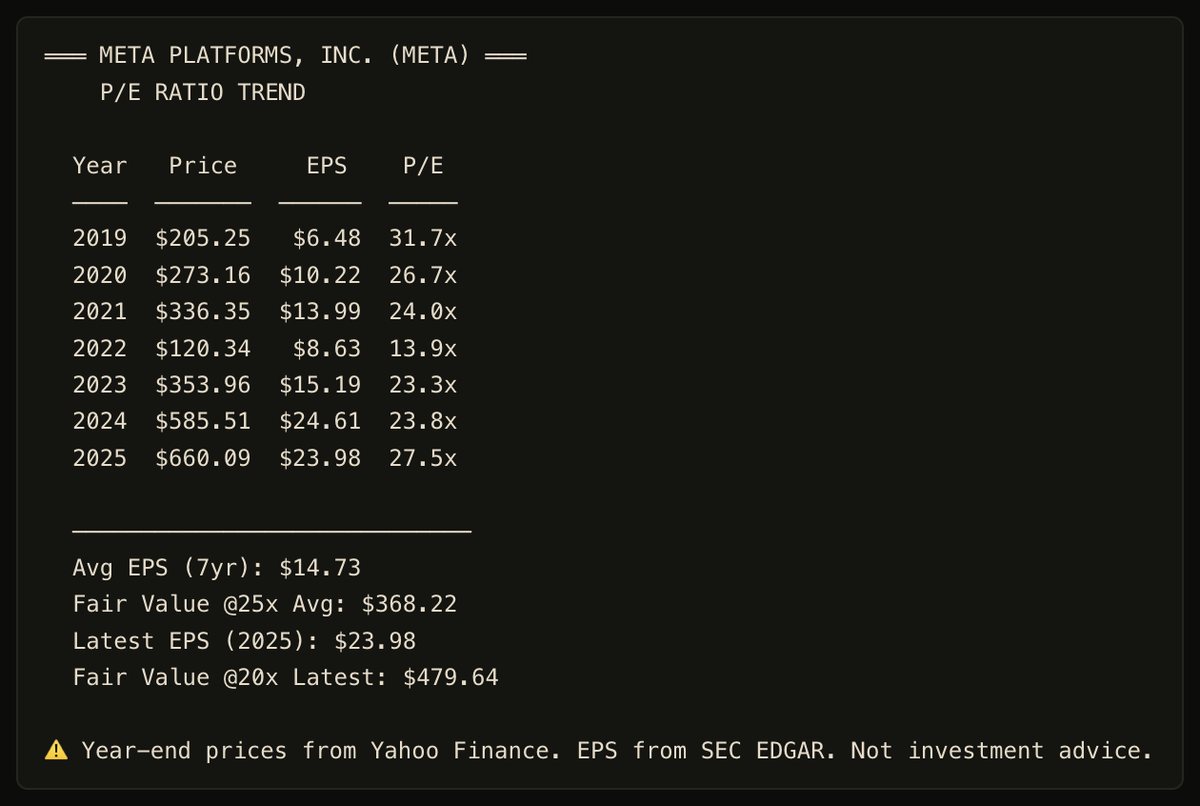
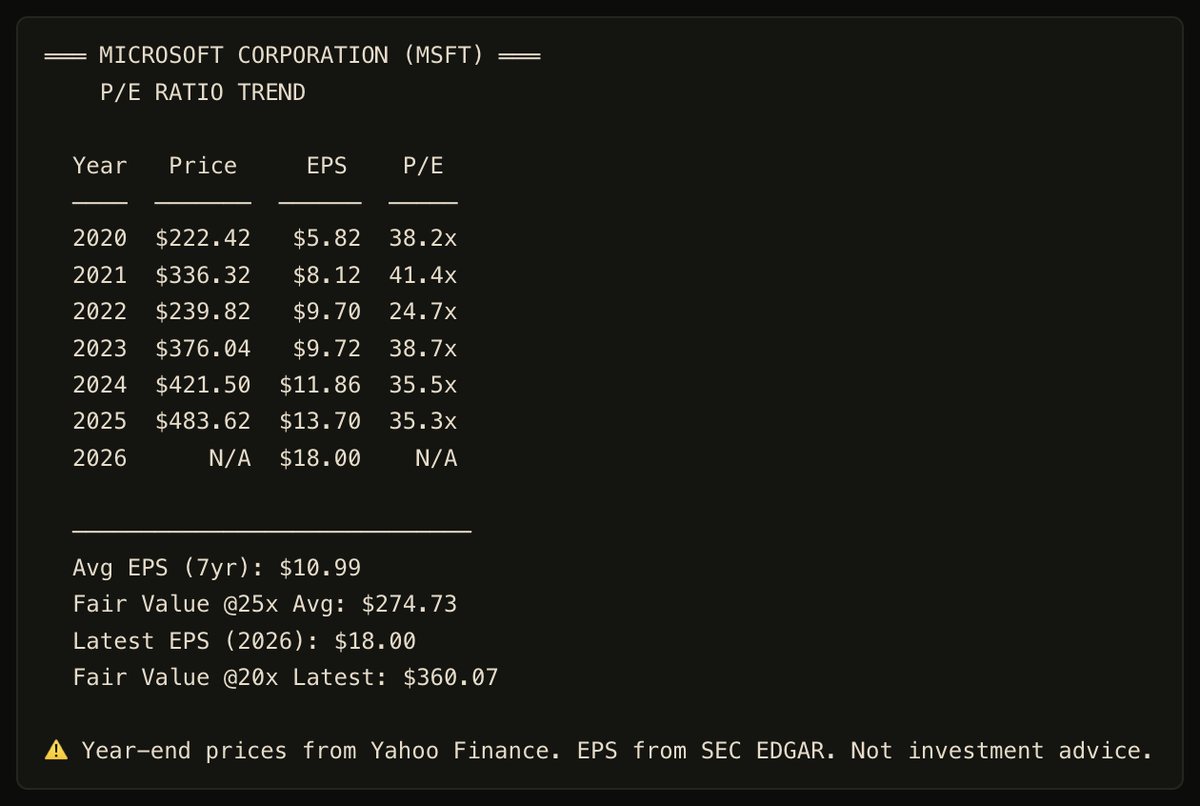
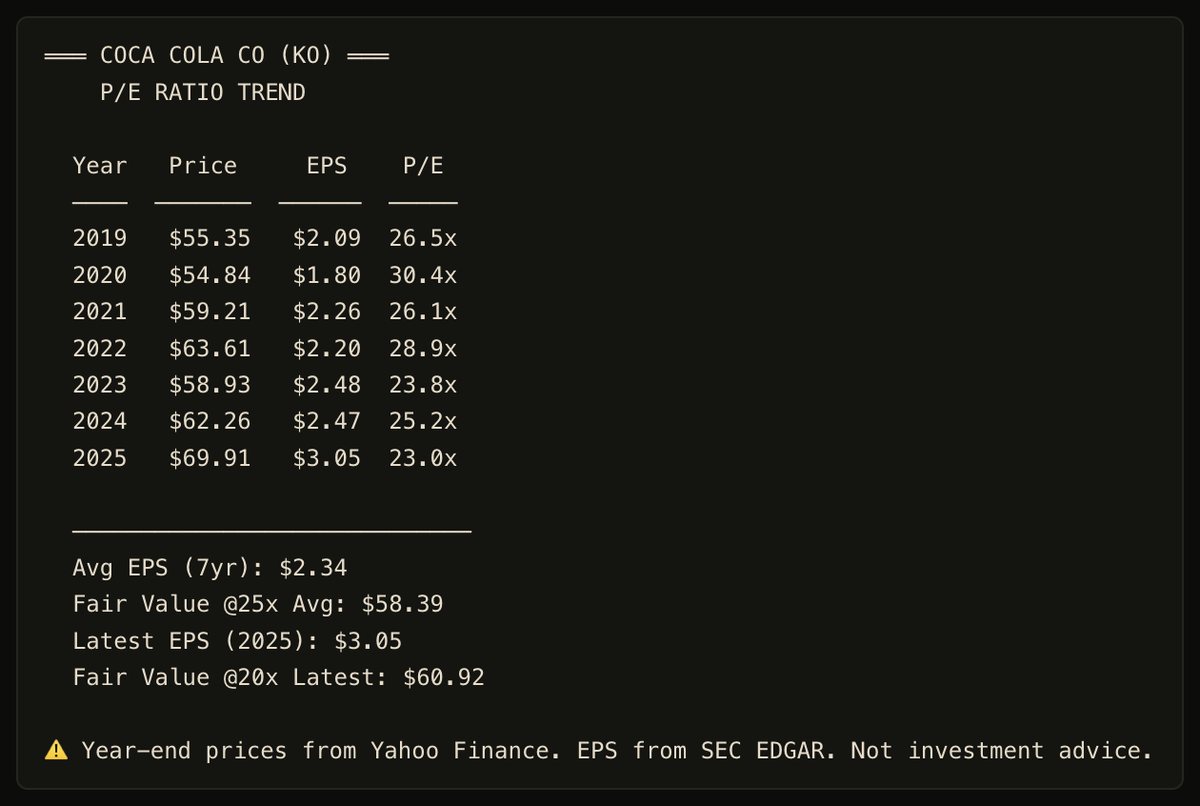
This is the heart of Angreal. P/E Trend lines up 7 years of earnings per share from SEC filings against each year-end stock price, then gives two fair-value estimates:

25× the 7-year average EPS, a through-the-cycle view, and 20× the latest year's EPS, a view based on the most recent year.

Type META pe ratio trend over time. Add last 10 years to change the window.

META pe ratio trend over timeMeta P/E trend 2019 to 2025 with average EPS $14.73, fair value at 25x average $368.22, and fair value at 20x latest $479.64
Meta, 2019–2025. P/E ranged from 13.9× at the 2022 low to 31.7×. Fair value: $368 at 25× average EPS, $480 at 20× 2025 EPS.
MSFT pe ratio trend over timeMicrosoft P/E trend 2020 to 2026 with fair value estimates
KO pe ratio trend over timeCoca-Cola P/E trend 2019 to 2025 with fair value estimates
8

Follow the cash to shareholders

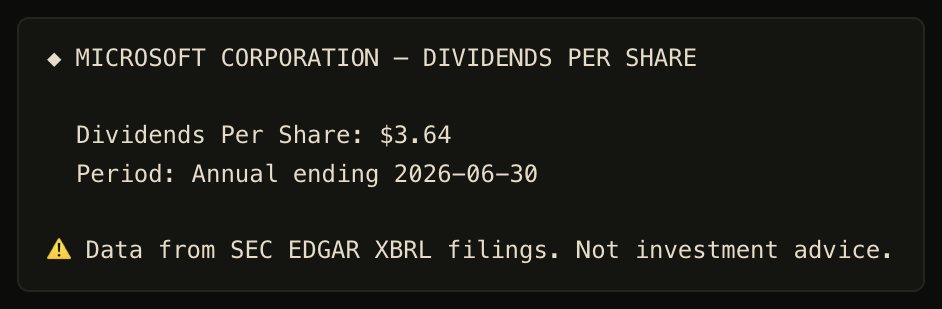
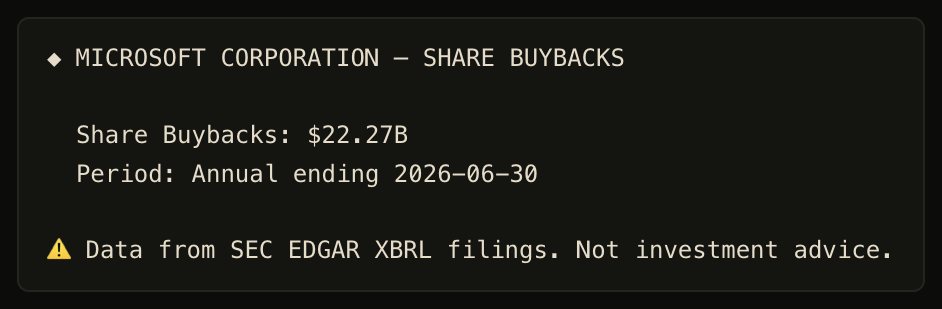
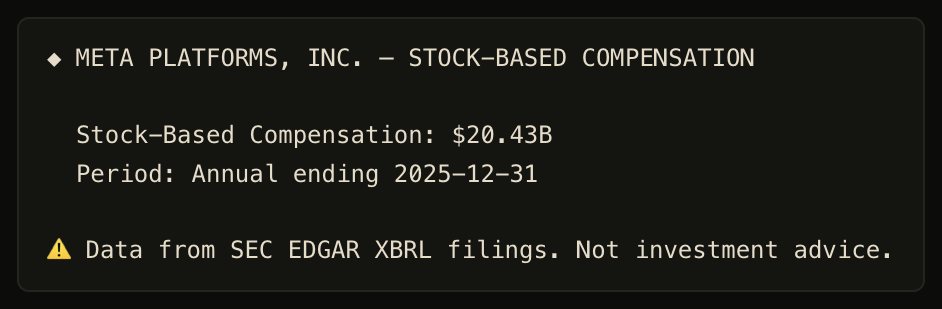
See what a company gives back to its owners and what it costs them. Dividends and buybacks show the cash returned. Stock-based compensation shows how much of employees' pay comes from shareholders' slice.

MSFT dividends per shareMicrosoft dividends per share: $3.64
MSFT buybackMicrosoft share buybacks: $22.27B
META stock-based compensationMeta stock-based compensation: $20.43B in 2025
9

Stress-test the balance sheet

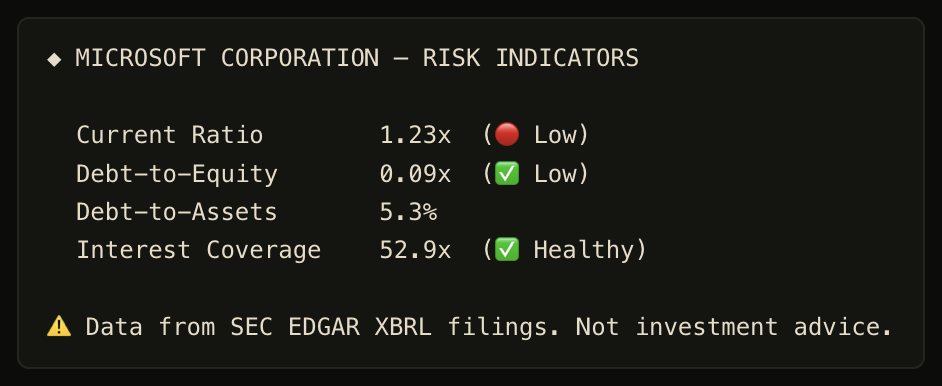
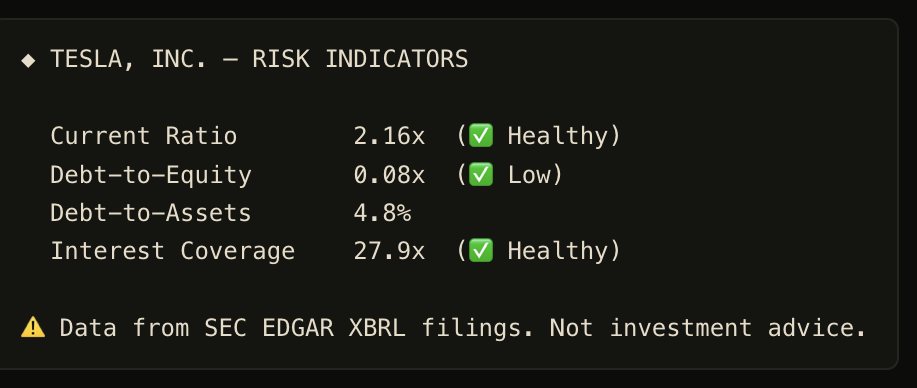
The risk check gives four solvency ratios, each graded: current ratio, debt-to-equity, debt-to-assets and interest coverage. It's a quick way to see whether a company could get through a bad year.

Ask How risky is TSLA? or MSFT financial health.

MSFT financial healthMicrosoft risk indicators: current ratio 1.23x, debt-to-equity 0.09x, interest coverage 52.9x
How risky is TSLA?Tesla risk indicators: current ratio 2.16x, debt-to-equity 0.08x, interest coverage 27.9x
10

Compare it with a peer

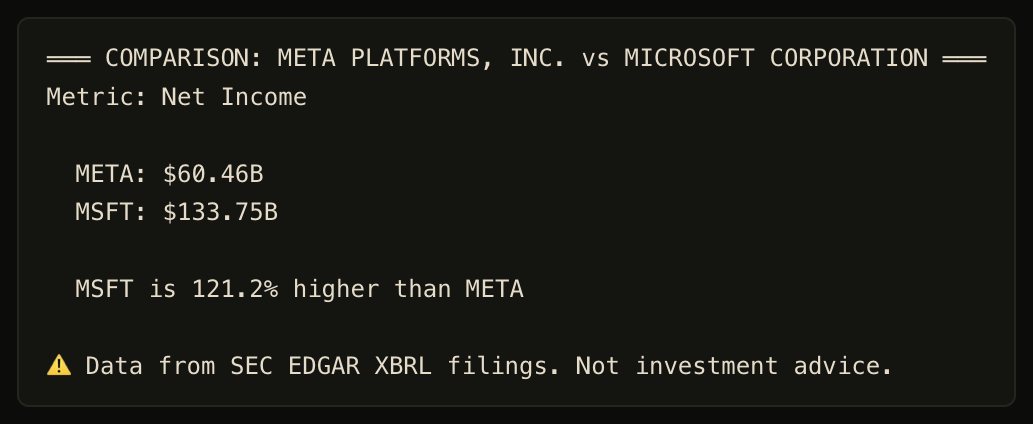
Put two companies side by side, either on a full set of metrics or on one specific line item.

Type Compare MSFT vs META net income.

Compare MSFT vs META net incomeComparison of net income: Meta $60.46B, Microsoft $133.75B
11

Go to the source

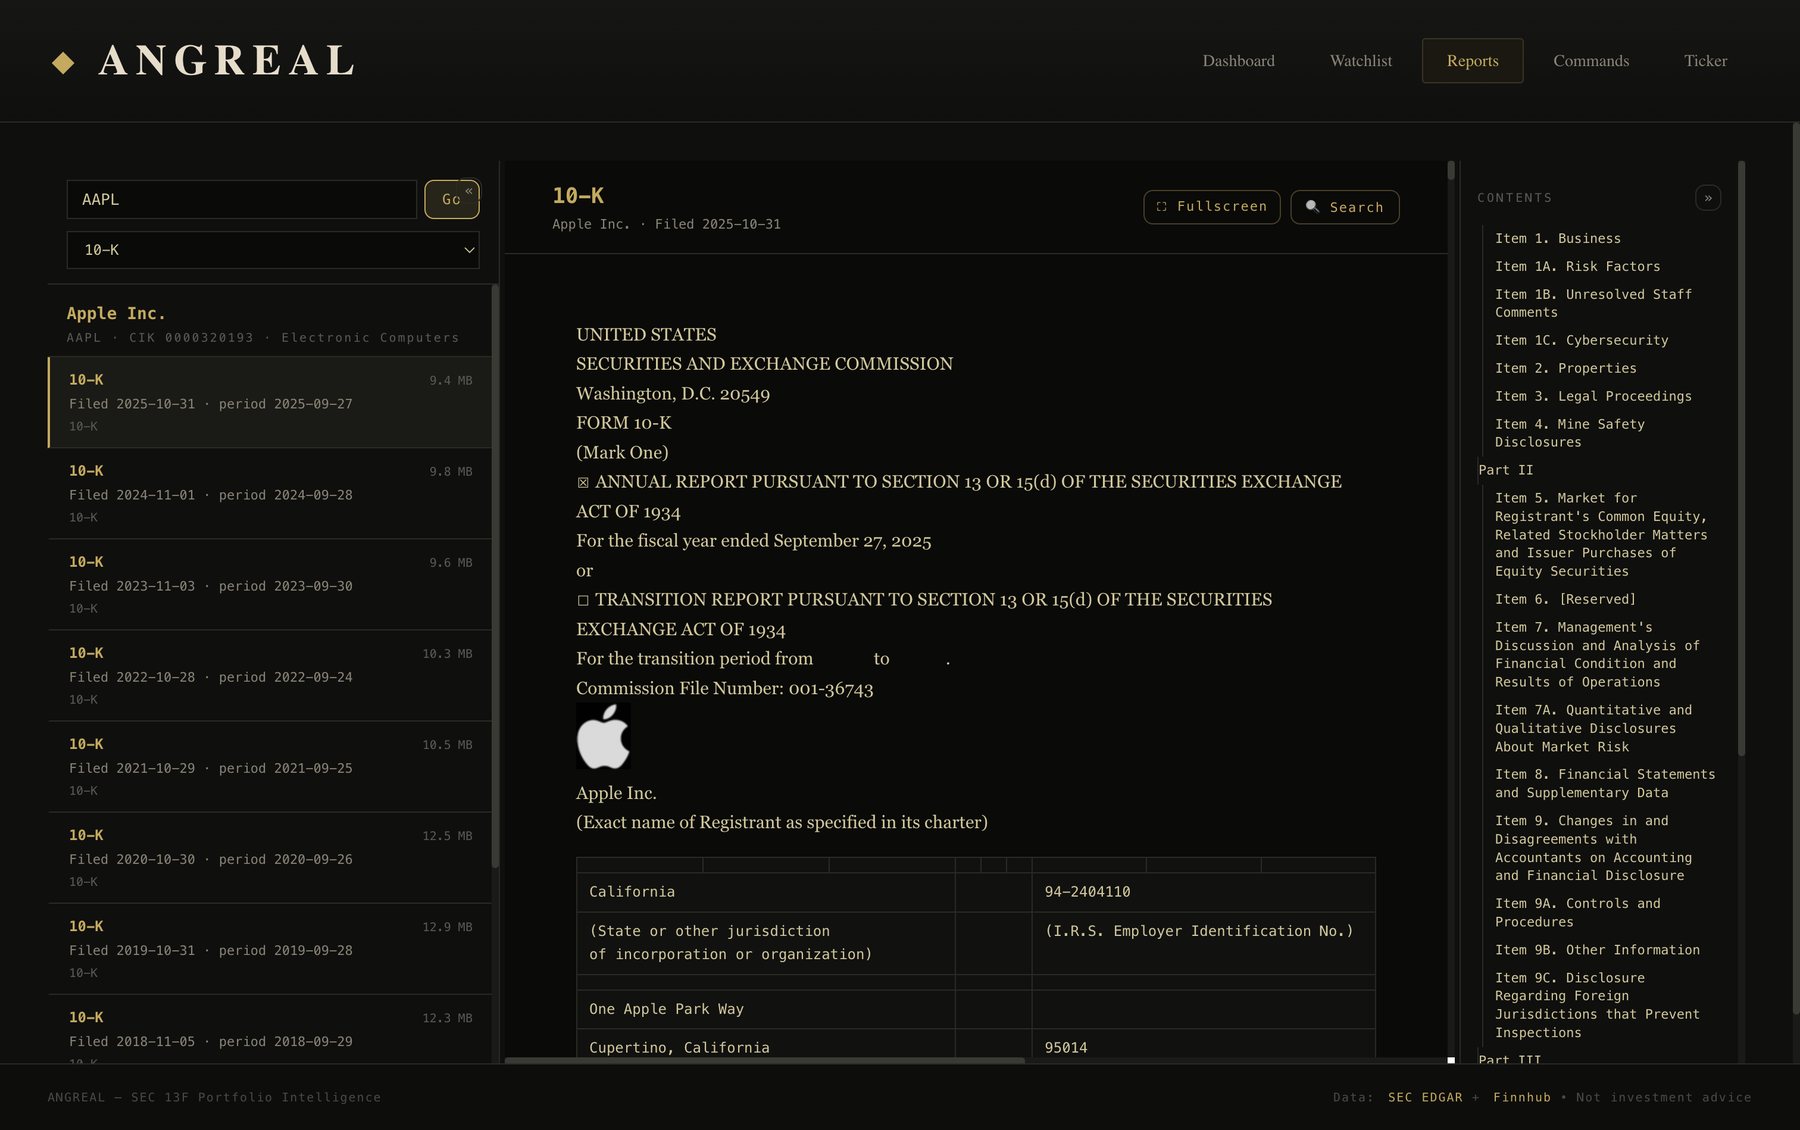
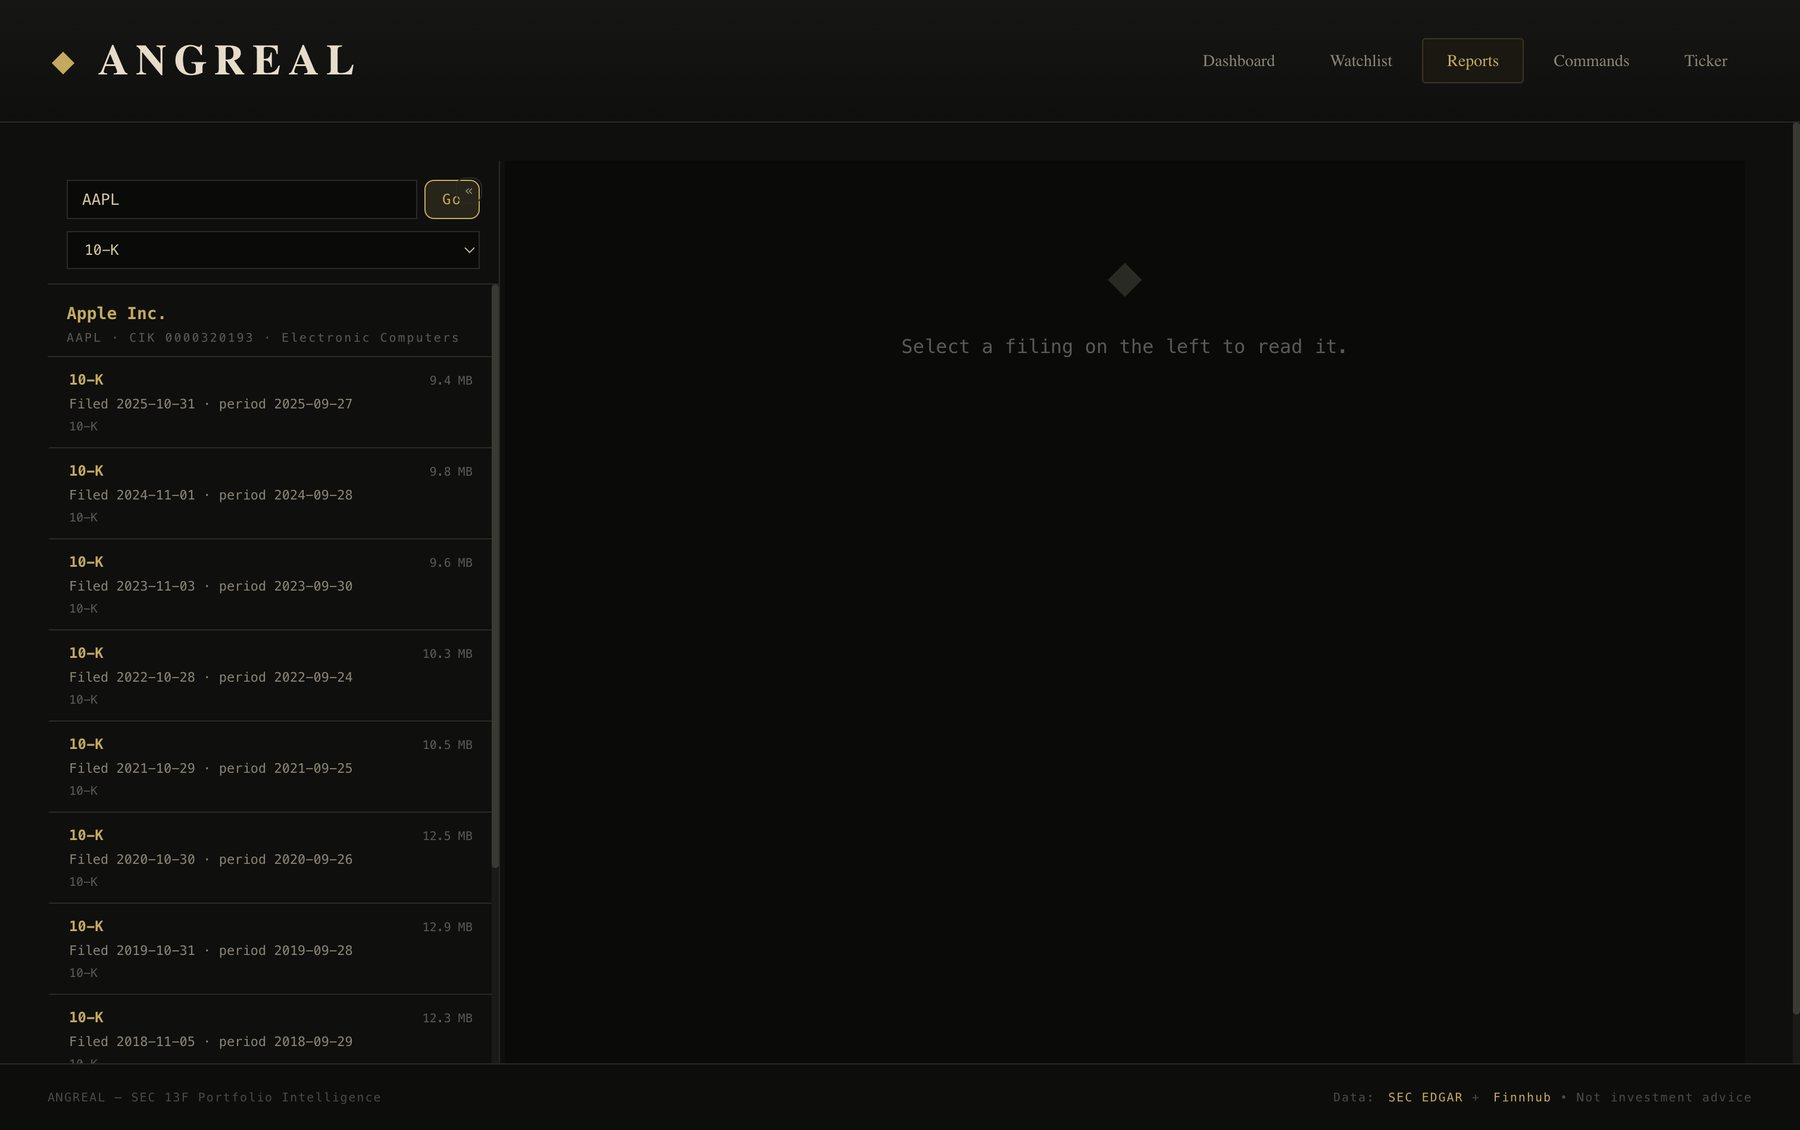
Numbers only tell part of the story. The Reports tab opens any filing a company has made with the SEC (10-Ks, 10-Qs, 8-Ks, proxies, S-1s, 13Fs and about 150 other form types) and renders it inside the app, with a clickable table of contents, search and full-screen reading.

Open Reports, enter a ticker, and pick a form type.

Apple's 2025 Form 10-K open in Angreal's reader with a table of contents on the right
Filing reader. Apple's FY2025 10-K. The contents panel on the right jumps to any section, such as Risk Factors or MD&A.
List of Apple 10-K filings from 2018 to 2025 with filing dates and sizes
Filing history. Every Apple 10-K back to 2018, with filing date, fiscal period and size.
12

Everything in one menu

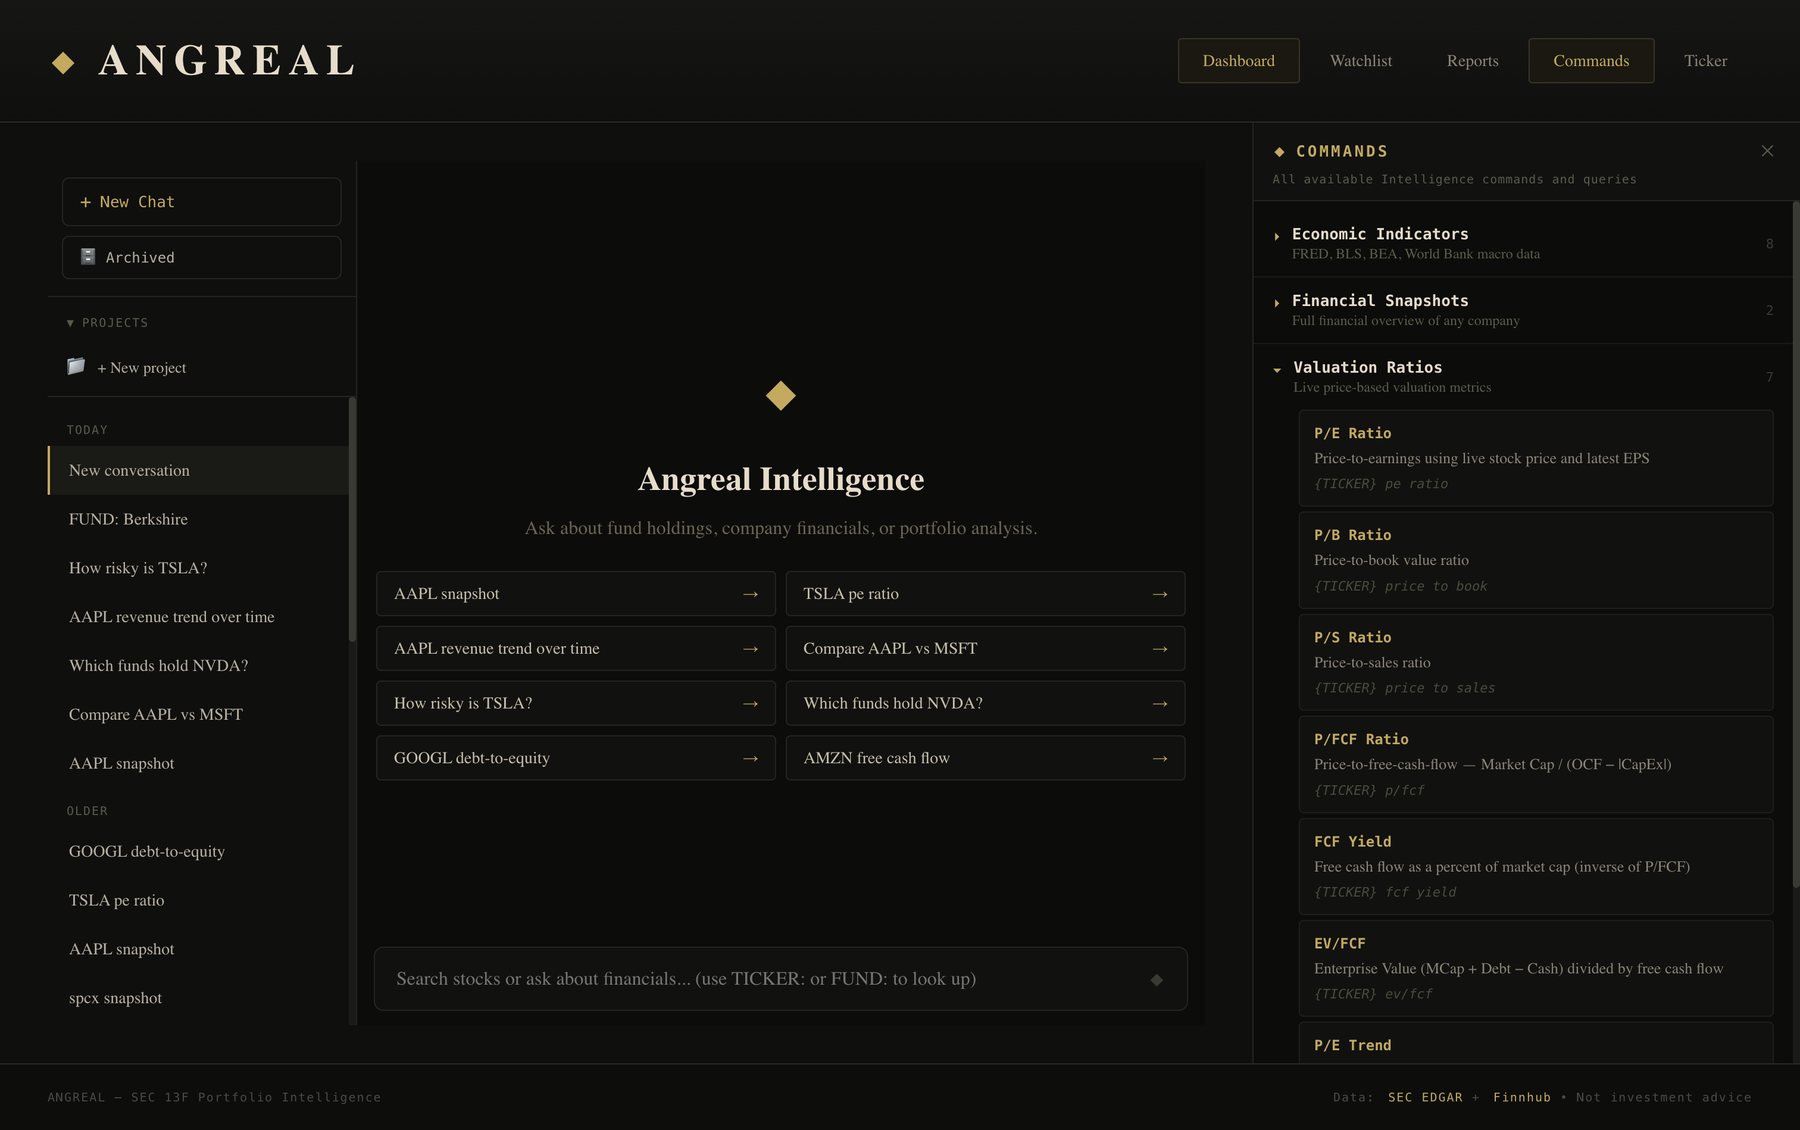
You don't need to memorize any phrasing. The Commands panel lists all 71 commands by category. Each one shows a description and an example, and runs with one click.

Commands panel with categories and the Valuation Ratios group expanded
Commands. 13 categories, from Economic Indicators to Fund & Portfolio Analysis. Valuation Ratios is expanded here.
Where it stands

Three versions, one product

I started Angreal on iPhone, moved it to the desktop when the research workflow needed more screen space, and I'm now rebuilding part of it for the web.

Most complete · private beta

macOS desktop app

Electron · v1.0 built May 2026

The full product shown on this page, packaged as a native Mac app.

  • Ships its own local API server, so all data requests run on the user's machine
  • Saves watchlists and chat history in a local SQLite database
  • Includes the economic dashboard, 71 commands, the filing reader and 13F fund tracking
React 19 · Vite · Electron · Node/Express · SQLite · D3
Early beta

Web: Angreal 13F

Started July 2026

A focused web version built around one job: searching 13F filings, the quarterly reports where large investors disclose their holdings.

  • Search by investment manager, SEC CIK, ticker or filing period
  • Stores normalized 13F filings, positions and quarter-over-quarter changes in its own database
  • A fresh rebuild: my first web app (spring 2026) is what became the desktop app
Next.js · Cloudflare Workers · D1 · Drizzle ORM · Tailwind
Prototype · paused

iOS app

SwiftUI · Feb–Mar 2026

The first version of Angreal, built as an iPhone portfolio tracker.

  • Followed fund portfolios from 13F filings, with donut-chart holdings breakdowns
  • Included watchlists with live prices, a macro dashboard and an AI chat
  • Paused so I could focus on the desktop app
Swift · SwiftUI · SEC EDGAR · FRED · BLS · BEA · Finnhub
  1. Feb 2026iOS prototype and first web prototype
  2. Spring 2026Web app grows into a full research tool
  3. May 2026Desktop app v1.0 packaged for macOS
  4. Jul 2026Angreal 13F web beta
  5. NowData-accuracy pass before a public release
What I'm working on now

Testing every number before a public release

Financial software is only useful if its numbers are right, so I'm checking Angreal's answers against what companies actually reported. That audit turned up a few edge cases in how public data is published, and fixing them is my priority before releasing the app publicly.

Under the hood

How it's built

Desktop app

React 19ViteElectronNode.js / ExpressSQLiteD3 chartselectron-builder

Data sources

SEC EDGAR (XBRL, 13F, full-text)FREDBLSBEAWorld BankFinnhubYahoo Finance

Web & iOS

Next.jsCloudflare Workers + D1Drizzle ORMTypeScriptSwift / SwiftUI

Want to see it live?

Angreal is in private beta. If you'd like a demo or want to talk about how it works, send me an email.